

Skip NavigationMarketsBusinessInvestingTechPolitics & PolicyVideoWatchlistInvesting Club PRO
 LivestreamMenu(This is The Best Stocks in the Market , brought to you by Josh Brown and Sean Russo of Ritholtz Wealth Management.) Josh — Two names we wrote up in September are back in today’s column. Meta Platforms (META) runs Facebook and Instagram. Cloudflare (NET) runs a global network and sells security and developer tools on top of it. Each came with a level for traders and a level for investors the day we published. Here’s where they stand. Not every entry looks good a few weeks later as news hits the tape and markets shift. We accept that going into our set-ups as being an endemic and unavoidable part of the equity market experience. Anyone who tells you otherwise is lying. Meta looked great when we wrote it up and then things changed when the company reported earnings. We don’t run and hide from episodes like this one, pretending it never happened. We use them to reinforce the necessity of managing risk and being flexible when the trend changes or the facts on the ground are no longer supportive. Cloudflare is a different story. We wrote it up on Sept. 21, and when software got hit this month, buyers stepped right back in. Sean’s got the usual Monday morning highlights from the list. I’ll be back with some technical commentary and risk management. As of Oct 26, there are 152 names on The Best Stocks in the Market list. Top sector ranking: Top industries: Top 5 best stocks by relative strength: Spotlight: META and NET Clean Up Meta Platforms, Inc. (META): Sean — We wrote about Meta on Sept. 28 , right after the Muse launch, with the stock at $752 and up 38% from its August low. We said Muse was the clearest evidence yet that the artificial intelligence spending was turning into a usable product. META has returned -14.5% since, against -1.5% for the S & P 500. It topped out at $762.50 on Oct. 13 and now trades at $643. Meta reported Q3 earnings on Oct. 21, and the reactions have been mixed. Revenue grew 26% to $64.6 billion, above the $63.3 billion analysts expected, and Q4 revenue was guided to $73 billion to $76 billion against $73.75 billion expected. Operating income fell 37% to $13.0 billion because of a $9.89 billion charge for the state attorneys general settlement. Excluding it, operating income grew 11% and EPS was $7.40. Management said more than 10 million people in the U.S. and Canada set up Muse agents in six weeks, exactly what we expected. The problem was cash flow. Q3 capex was $34.9 billion and full-year guidance moved to $135 billion-145 billion (low end up $5 billion). Free cash flow was negative $2.1 billion versus positive $10.6 billion a year ago, making this the first quarter of negative free cash flow for META since 2012. I was 14 years old, yikes. Meta also created a non-voting Class C share class, which gives it more room to raise capital for deployment. The stock was up as much as 5% after hours in response, then fell 7% on Oct. 22 and is quickly approaching crucial risk levels, which Josh is getting into here. Risk management: Josh — This is not a great set-up based on the work we do here in this column. However, it may be a great buy for investors who are focused on things like valuation metrics which we almost completely ignore. Technically, this chart is like getting smacked in the face with a greasy paper bag filled with lamb gyros. Yes, it could reverse hard and erase this month’s losses in a V-shaped recovery. No, I don’t want to bet on that happening. The trader stop we gave you on Sept. 28 was $685. The stock gapped down through it on Oct. 22 and opened at $676, which is where a stop order would have filled. If you followed the plan, you were out on the open before the stock closed near $649. That’s the system doing its job. The stock ran to $762 on Oct. 13, and the post-earnings selling Sean described above took it through the 50-day, which now sits overhead at $664. On Friday it dipped into the Muse gap, found a low at $633 right on the 200-day, and closed at $643. The set-up is broken, and $664 is the level the stock has to take back before that changes. With RSI at 36, momentum has gone from the 70s in late September to its weakest reading since the August low. That’s a full flush in about three weeks, and the stock hasn’t shown it can stop falling yet. A low reading on a broken chart tells you the selling has been heavy. It doesn’t tell you the selling is over. There’s no new trade here. Traders who followed the $685 stop are already out and have nothing to do but wait. Investors can still anchor to the $626 level we gave you on Sept. 28. The stock is about 3% above it, and the bottom of the Muse gap at $625 sits right underneath. A weekly close below $626 and the gap is filled for good, the 200-day is gone, and the old range is back in charge. Cloudflare, Inc. (NET): Sean — We wrote about Cloudflare on Sept. 21 in our cybersecurity column. Josh said it wasn’t a pure cyber play but belonged in the conversation, with the stock at a new high near $324 and a potential breakout in progress. NET has returned 0.7% since, against -0.2% for the S & P 500, but the path was rough. It ran to $361 by Oct. 9, then fell 19% to $292 by Oct. 20 in a sell-off in AI and richly valued software. Cloudflare runs a global network that sits between the internet and its customers. It sells security and a developer platform that lets companies build and run applications on that same network. The AI angle is traffic. Management said non-human traffic passed 50% of the network in Q2, with daily AI agent requests up more than 1,700% year over year. Valuation is what the bears love to point at for this stock. At today’s $326 level, NET trades at roughly 260x the midpoint of this year’s non-GAAP EPS guidance ($1.25-1.26). Cloudflare reports Q3 earnings on Nov. 5 after the close to prove the valuation is worth its weight. Buckle up. Risk management: Josh — When do you buy the dip? When the trend holds up despite a short-term setback and the buyers let you know they’re still out there. That’s what we have in NET right now, I will explain: Cloudflare has been making higher lows and higher highs since the spring, with the 50-day rising underneath it the whole way. The early September lows came in near $270. The October low came in at $285, higher. The October high near $363 cleared every peak before it. The software sell-off Sean described above hit a stock in an uptrend and the trend held. Look at Oct. 20. The stock traded down through the Oct. 16 low, hit $285, and closed right back at $292, a doji with long wicks on both sides. That’s a rejection of the low. Selling stopped there. The next day closed above the top of that candle, and Friday’s 7% jump took the stock back over the 50-day at $319 to close at $326, with the 200-day rising at $245. We like. That’s buyer tenacity. The $363 high is the level to clear. With RSI at 51, momentum flushed from the 60s in early October into the low 30s at the bottom and is back in the middle of its range within a week. Price held its higher low while momentum reset, which is what you want from a trend that’s still intact. That leaves plenty of room for a run at $363 without starting from a stretched reading. Healthy! Traders can use $299 as their stop. That’s the top of the Oct. 20 doji, the level the stock had to close above to confirm that selling had stopped. A close back below it and the confirmation failed. You get your answer early, before a small loss turns into a big one. Investors can anchor to $285, the low the market rejected and the higher low the whole uptrend rests on. A weekly close below $285 breaks the sequence of higher lows. DISCLOSURES: (None) All opinions expressed by the CNBC Pro contributors are solely their opinions and do not reflect the opinions of CNBC, or its parent company or affiliates, and may have been previously disseminated by them on television, radio, internet or another medium. THIS CONTENT IS PROVIDED FOR INFORMATIONAL PURPOSES ONLY AND DOES NOT CONSTITUTE FINANCIAL, INVESTMENT, TAX OR LEGAL ADVICE OR A RECOMMENDATION TO BUY ANY SECURITY OR OTHER FINANCIAL ASSET. THE CONTENT IS GENERAL IN NATURE AND DOES NOT REFLECT ANY INDIVIDUAL’S UNIQUE PERSONAL CIRCUMSTANCES. THE ABOVE CONTENT MIGHT NOT BE SUITABLE FOR YOUR PARTICULAR CIRCUMSTANCES. BEFORE MAKING ANY FINANCIAL DECISIONS, YOU SHOULD STRONGLY CONSIDER SEEKING ADVICE FROM YOUR OWN FINANCIAL OR INVESTMENT ADVISOR. Click here for the full disclaimer.Read More
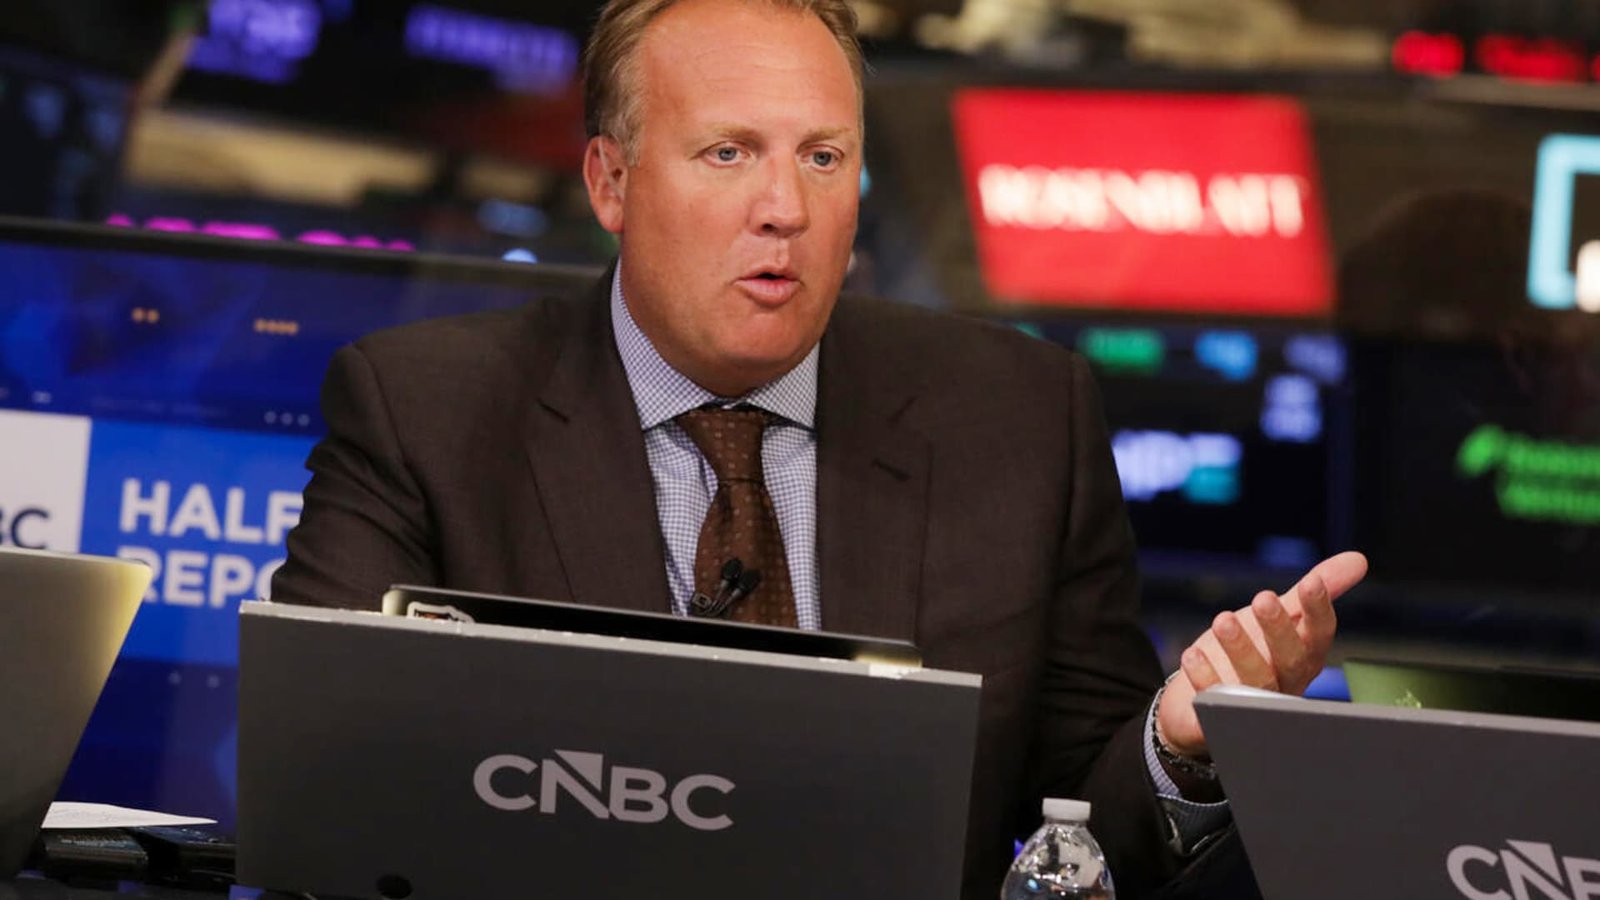
Josh Brown says Meta is near crucial levels. How he’s trading the tech giant
The CEO of Ritholtz Wealth Management takes a look at the levels he’s watching in the stock.

by
Read Time
About the Author

Previous Post
Next Post
Leave a Reply
Latest News



Stay Connected
Categories
BBC News CNA CNBC CNN International Deutsche Welle (DW) Euronews France 24 General Global & European Specialized & Regional
Tags
amp Artificial intelligence Asia Breaking News: Business Breaking News: Markets Breaking News: Politics Breaking News: Technology Business business news cent china cup Donald J. Trump Donald Trump economy European Union fast football France germany india Investment strategy iran Iran war markets People per politics return russia S&P 500 Index said Singapore spain Sport Stock markets technology trump ukraine United States US-Israel attack on Iran 2026 video War in Ukraine World World Cup 2026
About the Author

AF themes
Easy WordPress Websites Builder: Versatile Demos for Blogs, News, eCommerce and More – One-Click Import, No Coding! 1000+ Ready-made Templates for Stunning Newspaper, Magazine, Blog, and Publishing Websites.

Search the Archives
Access over the years of investigative journalism and breaking reports


